Debugging Modules
When developing Modules, it's very useful to be able to debug code inside the Module. Intent Architect supports this by pausing the Software Factory Execution process in order to allow you to connect a debugger to the running process.
For example, to debug using Visual Studio:
Run the Software Factory Execution in DEBUG mode by clicking on the down arrow next to the Run Software Factory button and then selecting Run with Debugging. The Software Factory Execution will launch and pause with a
Attach Debuggerdialog awaiting for confirmation to proceed.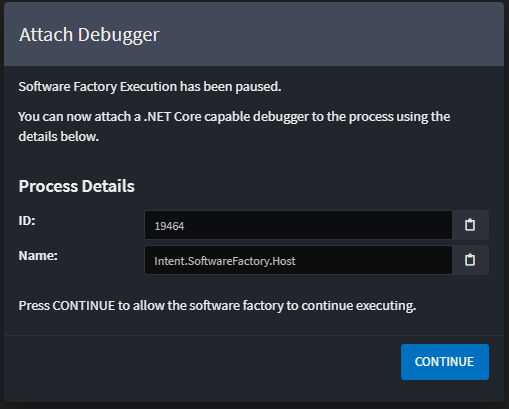
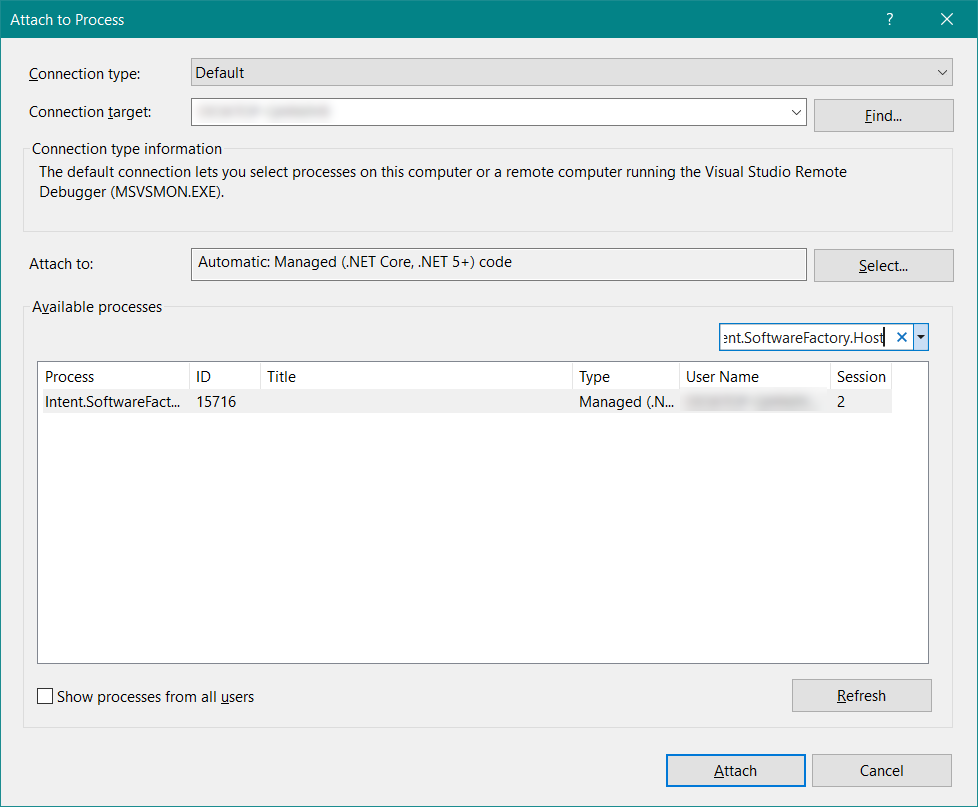
Use the process ID or Name to attach the debugger in your IDE.
Click the
OKbutton on theAttach Debuggerdialog.
The breakpoints in your module will now be hit: